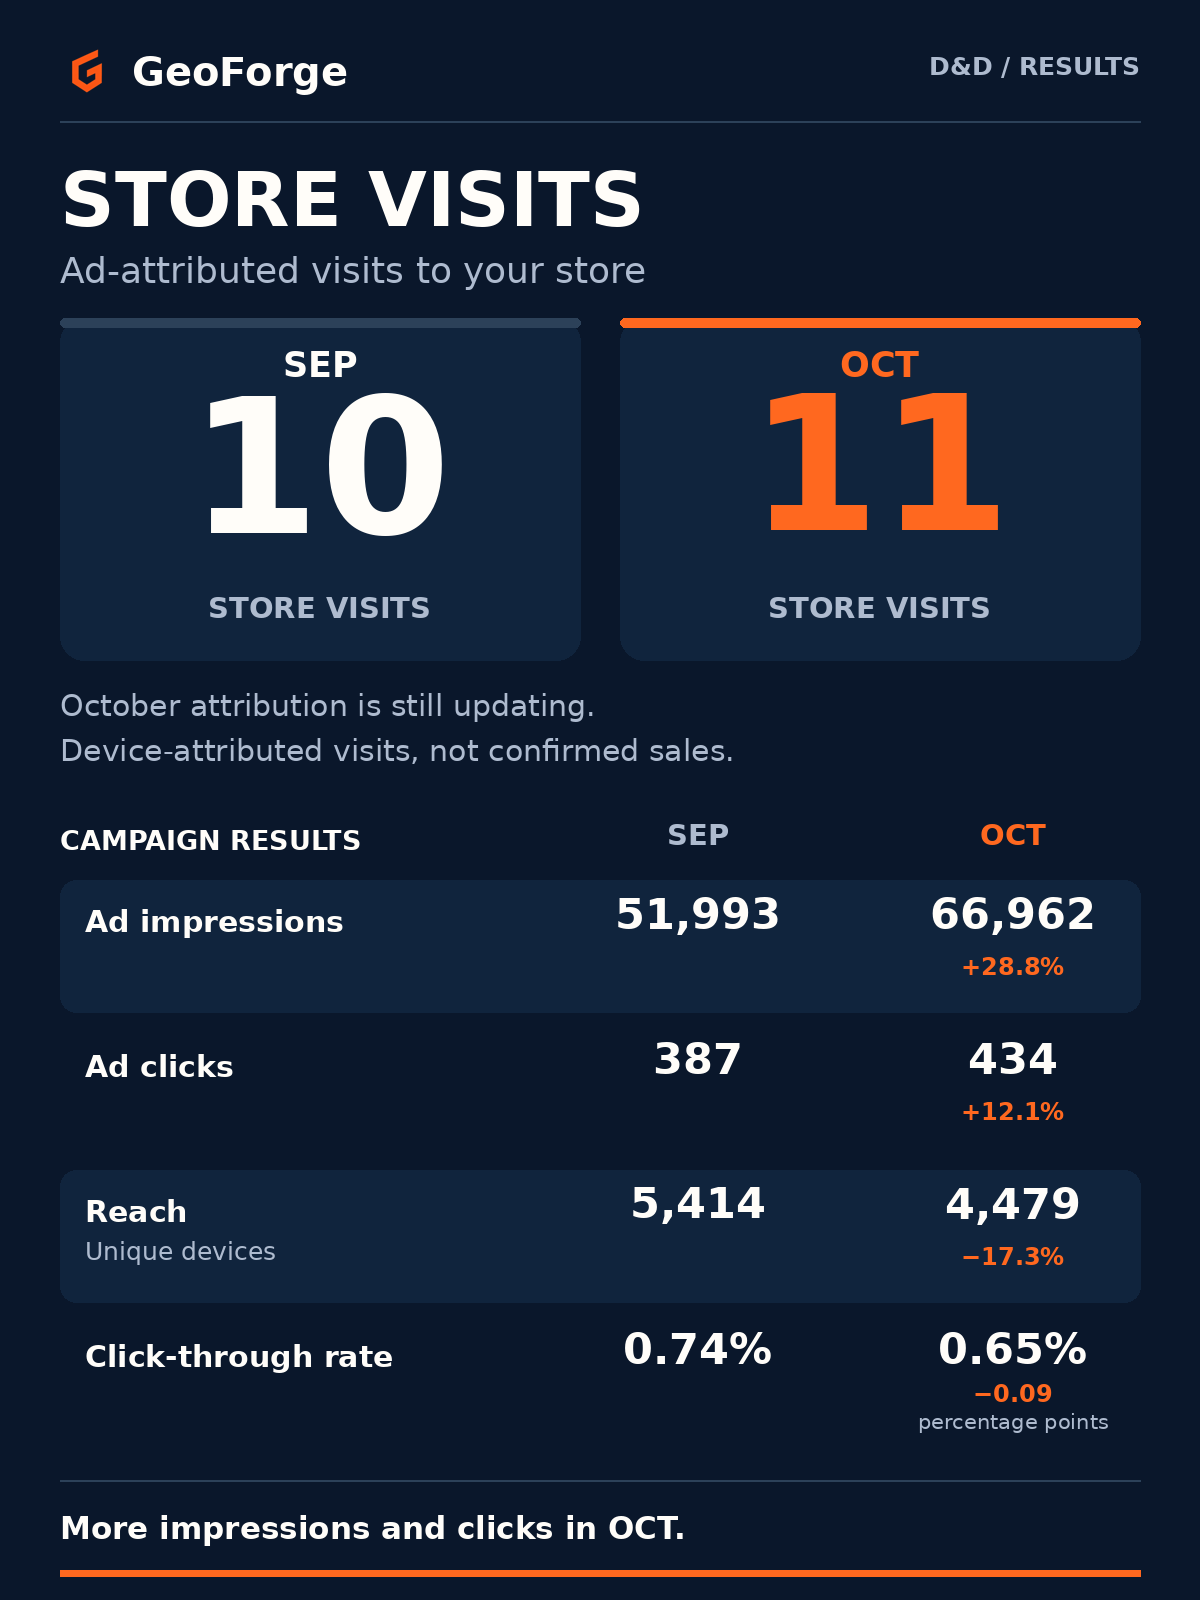
SEPSTORE VISITS
10
Ad-attributed store visits
 GeoForge
Your results, beyond the screen.
Ad-attributed store visits
Ad-attributed store visits Still updating
Each marker represents one attributed store visit.
Visits are attributed to ads using device data, not confirmed sales.
OCT attribution is still updating.
Both months delivered more impressions than the Standard package estimate. OCT also delivered more impressions and clicks than SEP.
Explore the full picture01 / YOUR PACKAGE VS. DELIVERY
Standard package
~40,000 impressions / month
Currently published estimate
+48.7%above the combined ~80,000 estimate
Compared with the currently published Standard package estimate. Estimates are not guarantees or historical contract terms. Clicks and store visits are reported results, not promised package targets.
02 / EXPLORE THE FULL PICTURE
Compare SEP with OCT.
See what changed and what each number means.
An impression is one display of your ad. One person can see an ad more than once.
OCT added 14,969 ad impressions compared with SEP.
| Metric | SEP | OCT | Change |
|---|---|---|---|
| Ad impressionsTimes your ads were shown | 51,993 | 66,962 | +28.8% |
| Ad clicksClicks on your ads | 387 | 434 | +12.1% |
| ReachUnique devices | 5,414 | 4,479 | −17.3% |
| Click-through rateClicks as a share of impressions | 0.74% | 0.65% | −0.09 percentage points |
More impressions and clicks do not mean every measure increased. Reach and click-through rate were lower in OCT. Reach counts unique devices within each month and is not added across months.
TWO WAYS TO EXPLORE
Watch the recap, or keep the graphic
for an easy reference.
A quick visual walkthrough of store visits and campaign performance.
Open the complete comparison or save a copy to share.